Oracle JET tag cloud component to visualize data using new Dynamic Content Region (Part-1)
Learn how to integrate Oracle JET Tag Cloud in new region type and visualize data


Introduction
In the latest version of Oracle APEX 22.2, a new dynamic content region has been introduced which is an impressive feature. The most notable thing about this region type is refreshable and supports lazy loading.
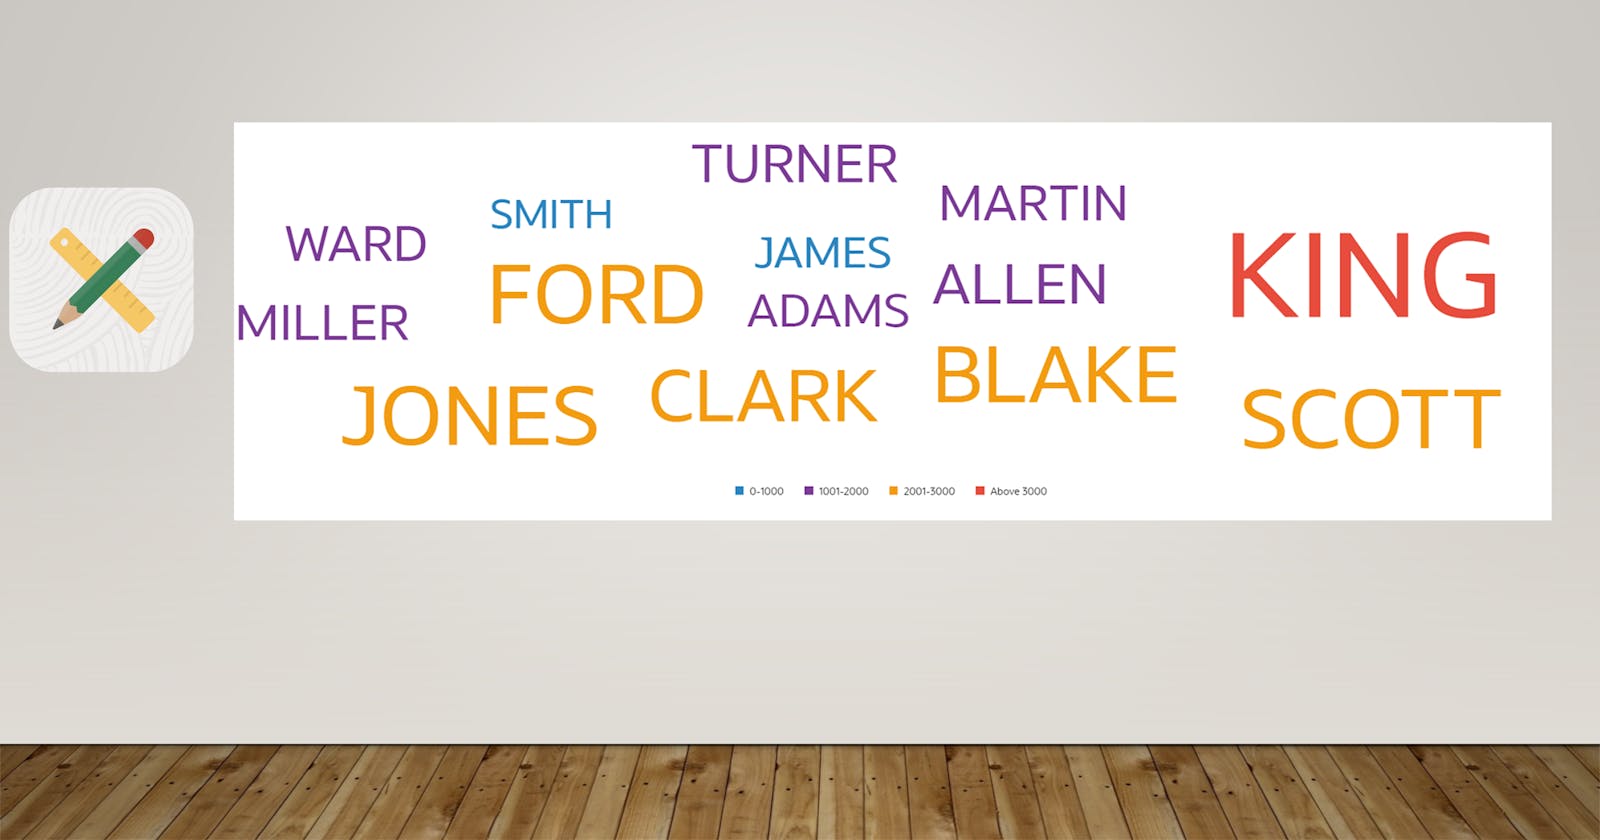
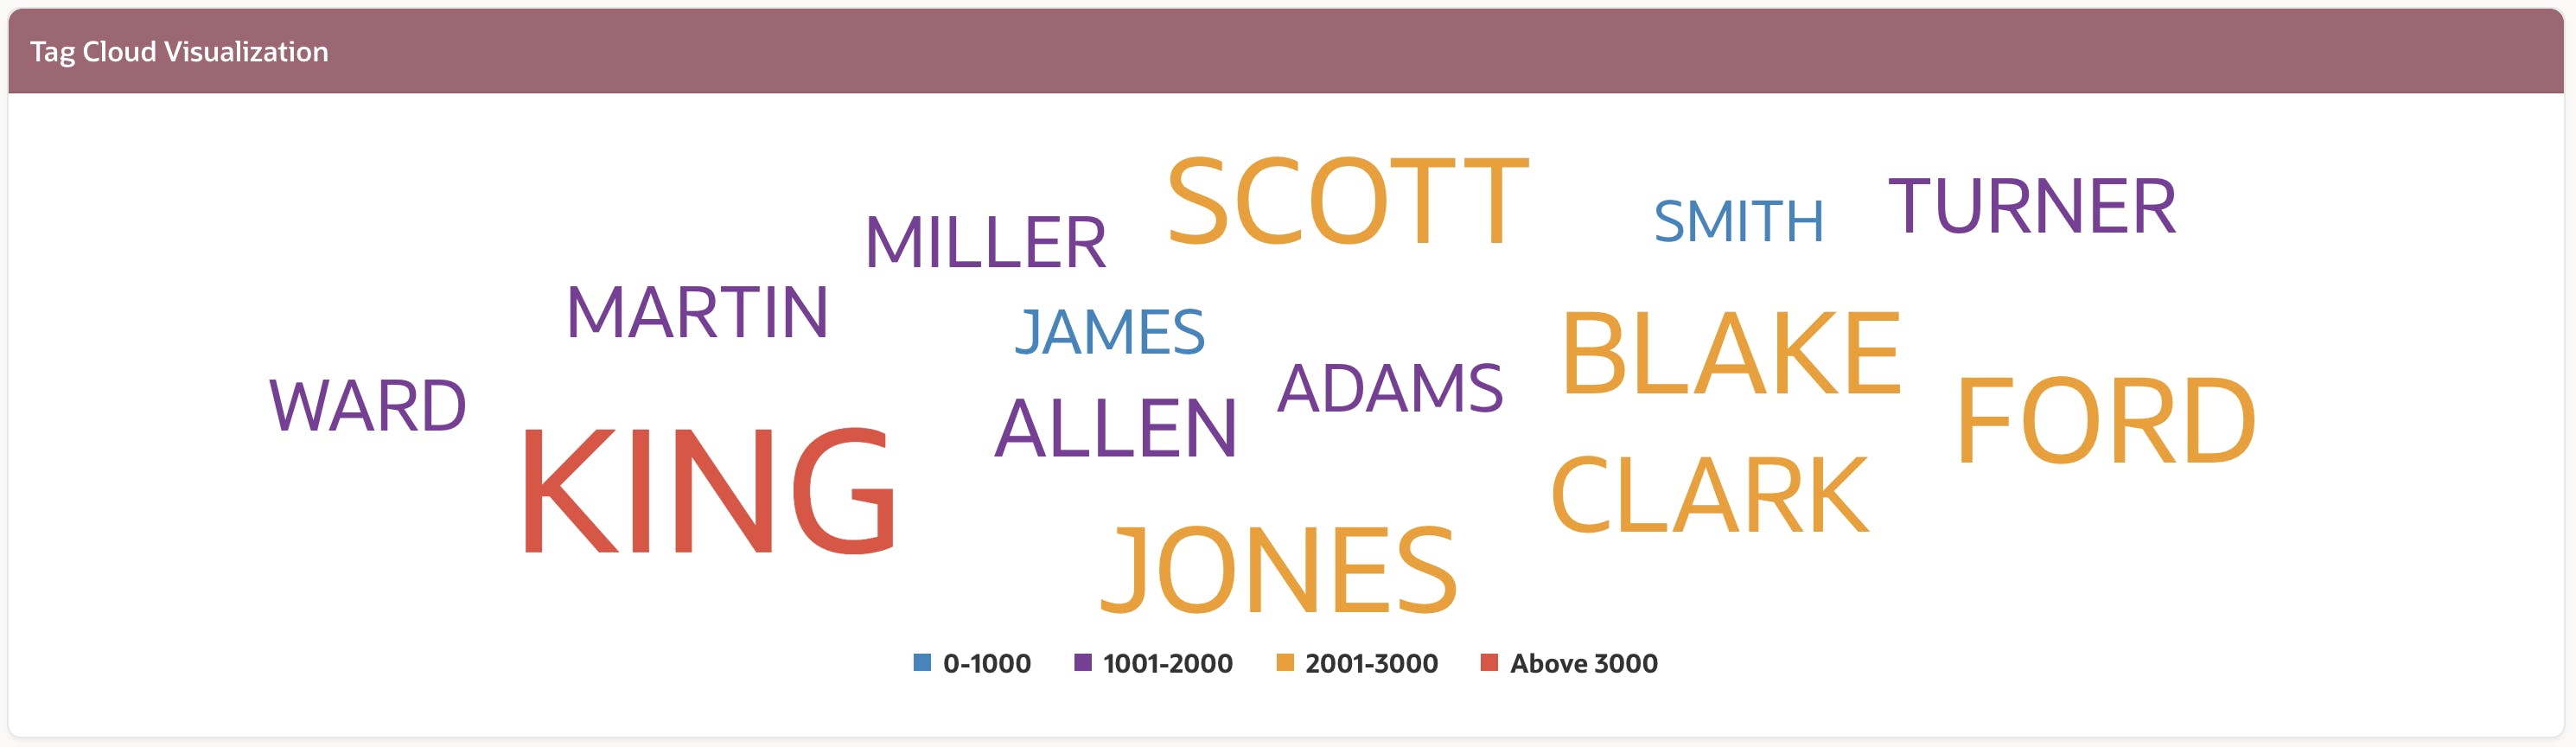
In this three-part blog post, I will show how Oracle JET Tag Cloud and Legend components can easily be integrated to present data with drill-down functionality. You should be able to achieve the below output after going through all the parts and performing all the steps. In addition to the latest version of APEX, the database version should be 19c or above to implement the method described in the blog post.

This new refreshable region can easily replace the need of developing a complex regional plug-in to integrate the Oracle JET component or any third-party JS library. I hope that you will be amazed to see how easy is to integrate the Oracle JET component to enhance your application functionality using the new dynamic content region. To integrate any Oracle JET visualization component, I will strongly recommend visiting the Oracle JET cookbook application for more information and learning.
Now, let's follow these steps to visualize data.
Add / Load Oracle JET Library for the respective component
There are two methods to include the Oracle JET component library at the Page Level:
Implicit inclusion: When you create any chart region, the Oracle JET library is loaded by default. So, you don't need to specify JavaScript File URLs and CSS File URLs. You need to only load the respective component library using require JS module as follows:
require(["ojs/ojtagcloud","ojs/ojlegend"] , function() {});Explicit inclusion: Use
"[require jet]"in JavaScript File URLs attribute and include"#JET_CSS_DIRECTORY#alta/oj-alta-notag-min.css"in CSS File URLs attribute to load the respective JS & CSS library as shown in the below screenshot.

Add an Inline chart to load the Oracle JET library via the implicit method
As per the first step, I will use the implicit method to include Oracle JET Library and respective modules. Here, I have assumed that you might be creating JET Cloud Tag visualization along with other chart regions.
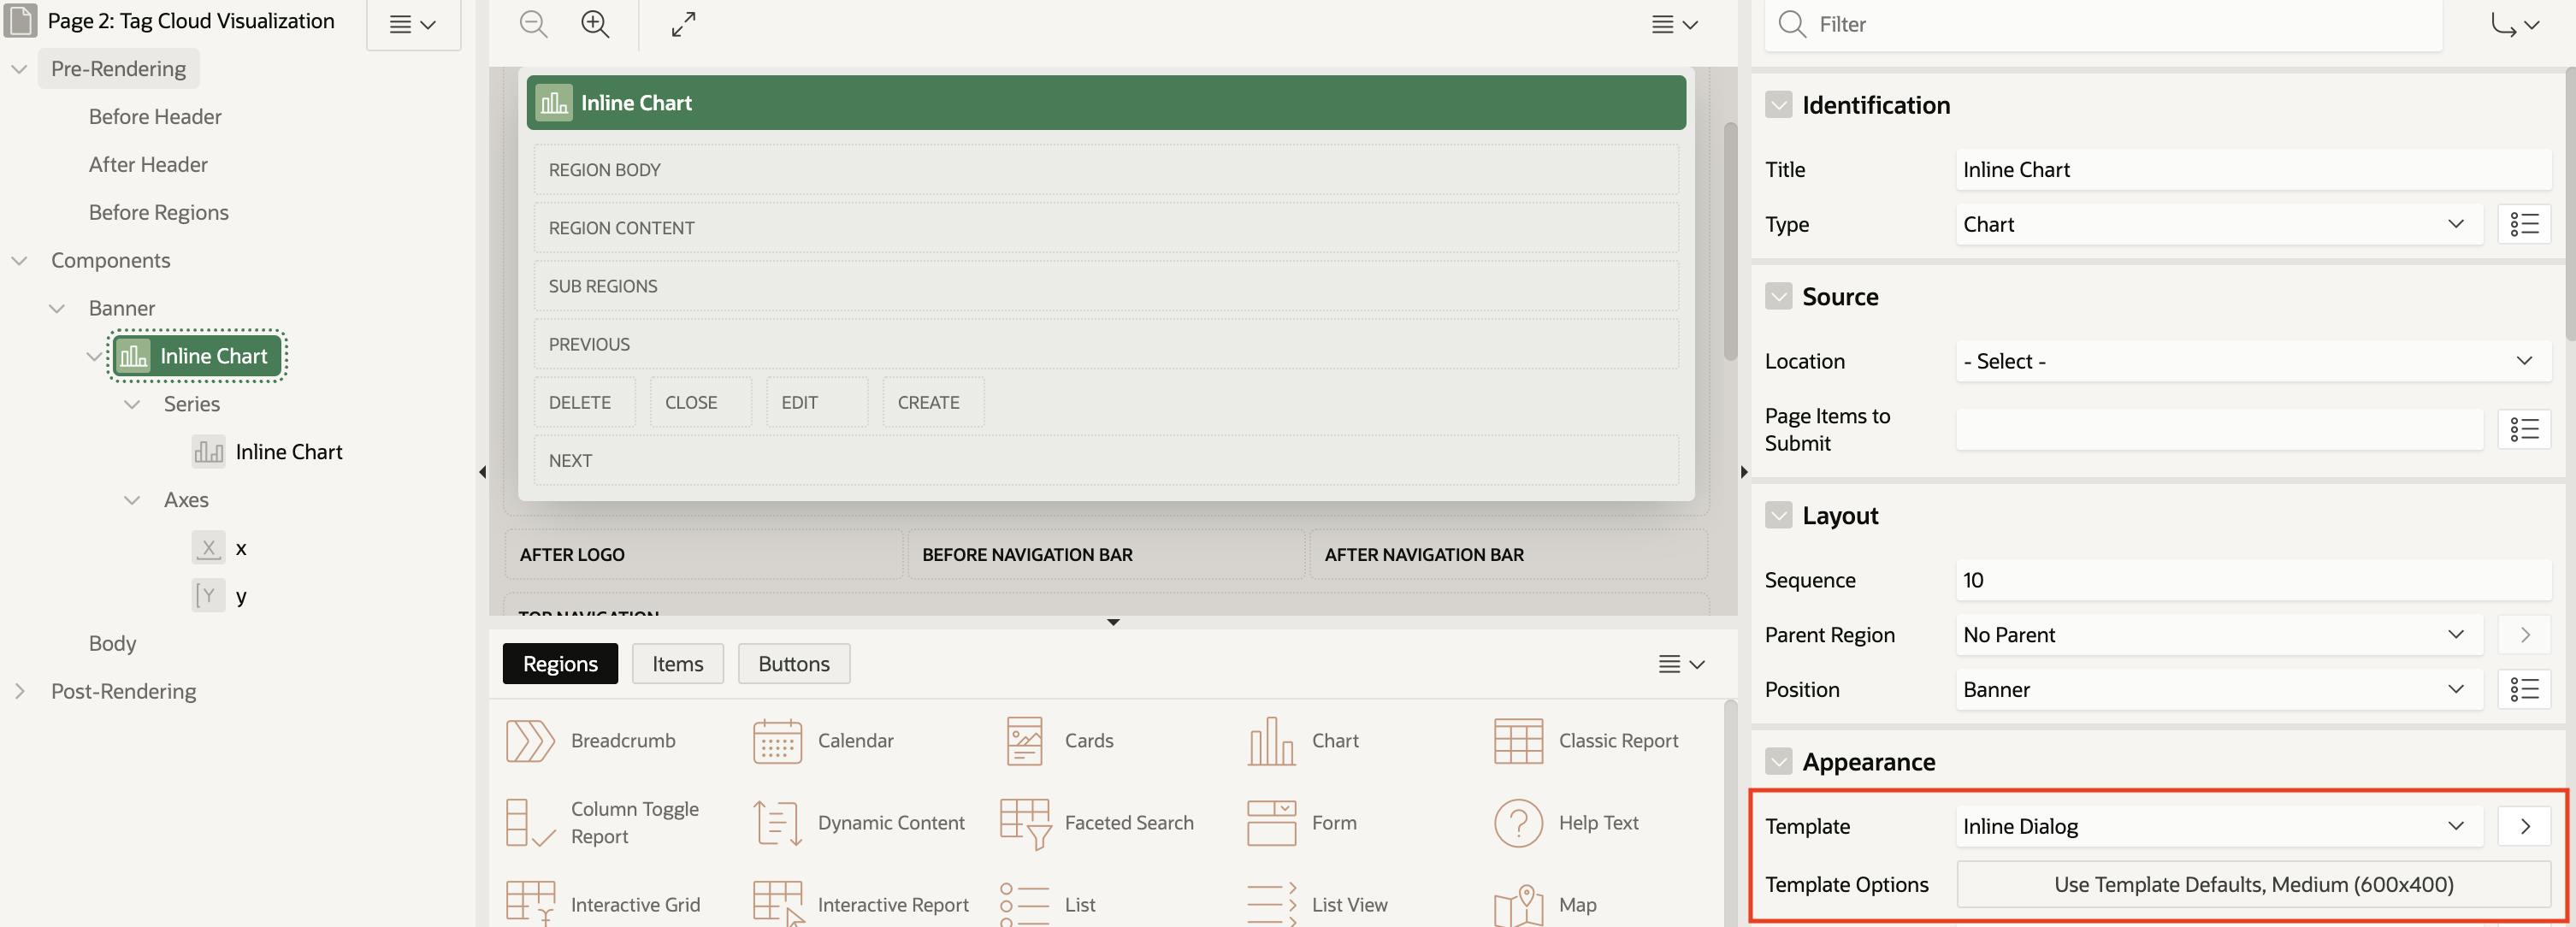
Place the chart region and set the template as "Inline Dialogue" as shown in the screenshot.
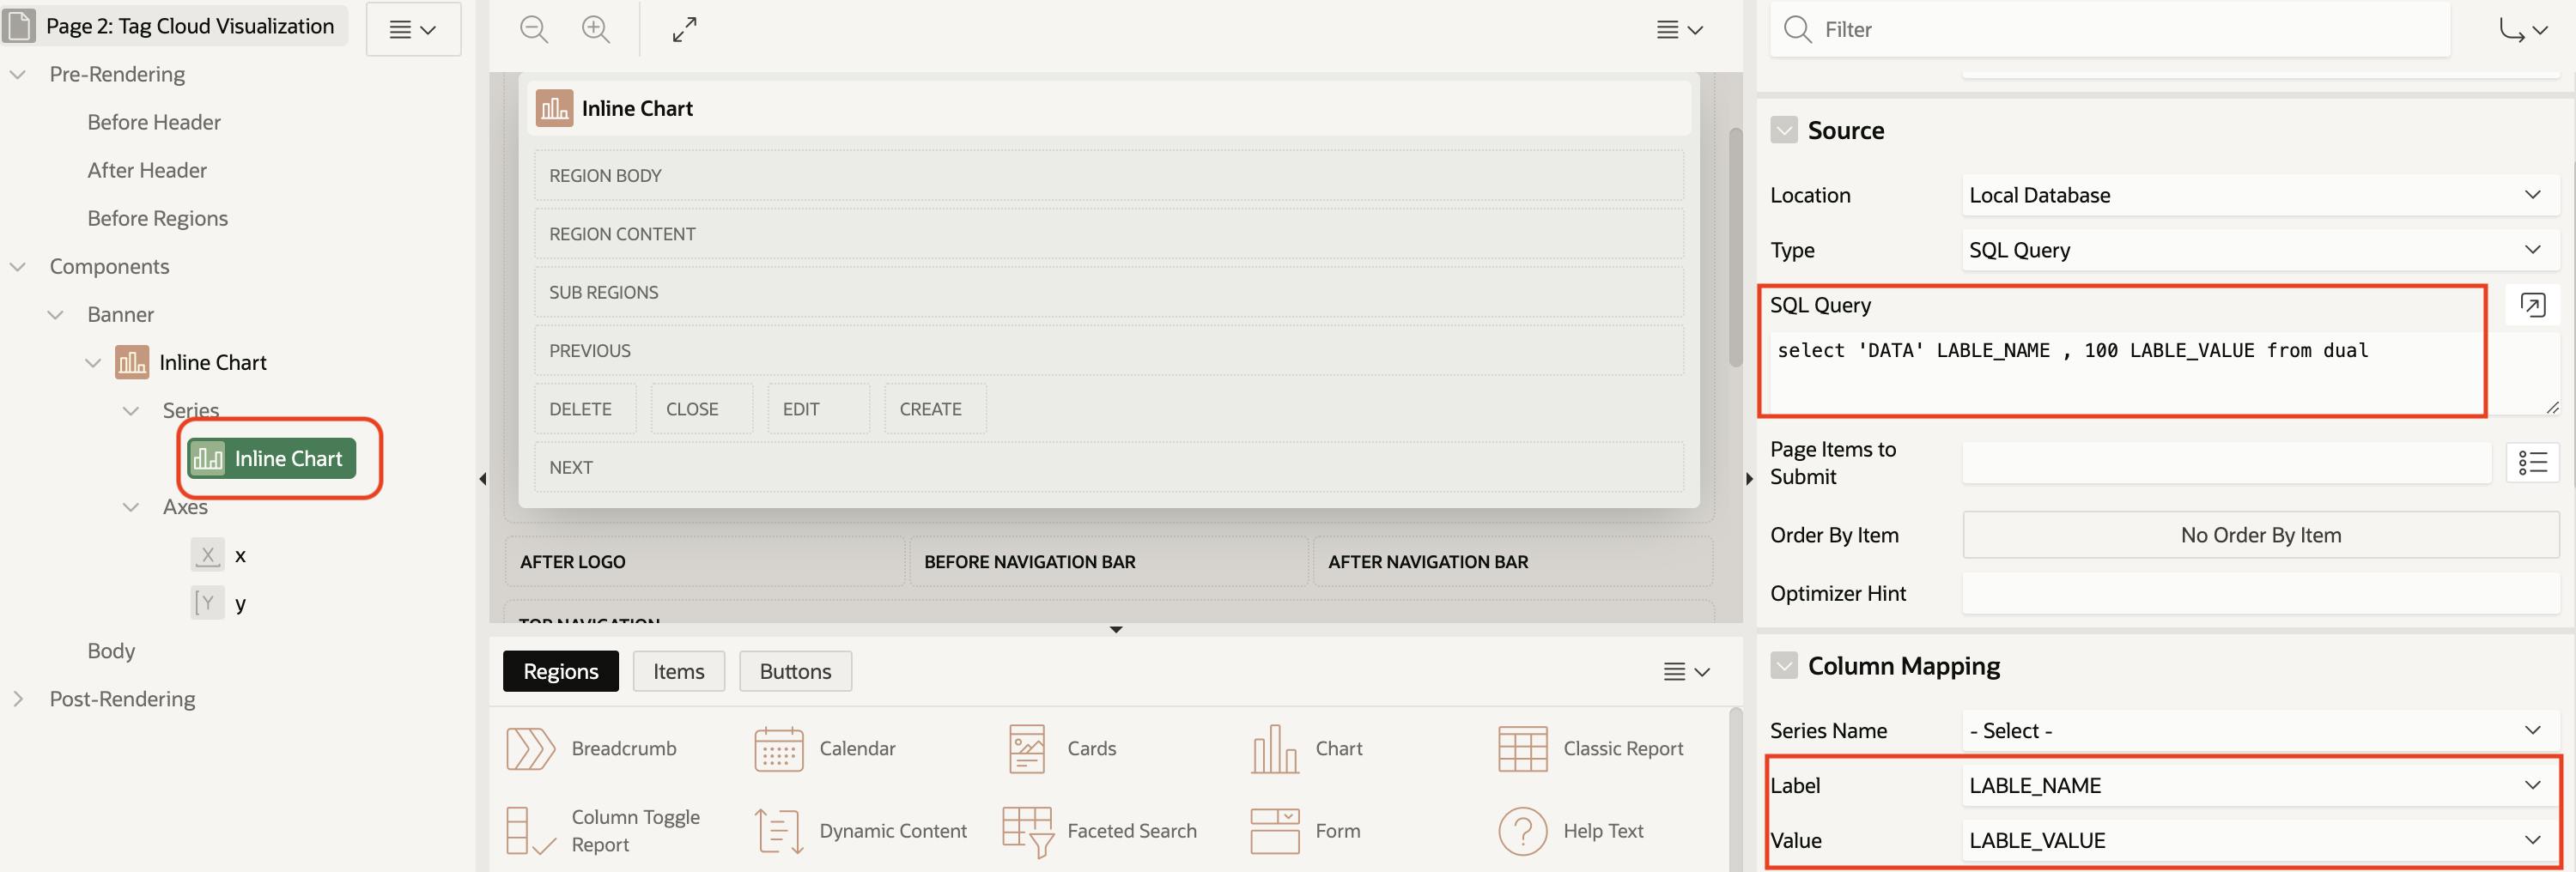
Write SQL Query and do the column mapping as shown in the screenshot.
select 'DATA' LABLE_NAME , 100 LABLE_VALUE from dual
Above steps will ensure that the Oracle JET library along with the required CSS files is loaded. The final step would be to load a specific JET module. You may also include such an inline JET chart on the global page to make sure the JET library is loaded for each page of an application.
In our case, we are going to use JET Tag Cloud and JET Legend components. So, you need to include the below code into the page attribute "Execute when Page Loads".
require(["ojs/ojtagcloud","ojs/ojlegend"] , function() {});
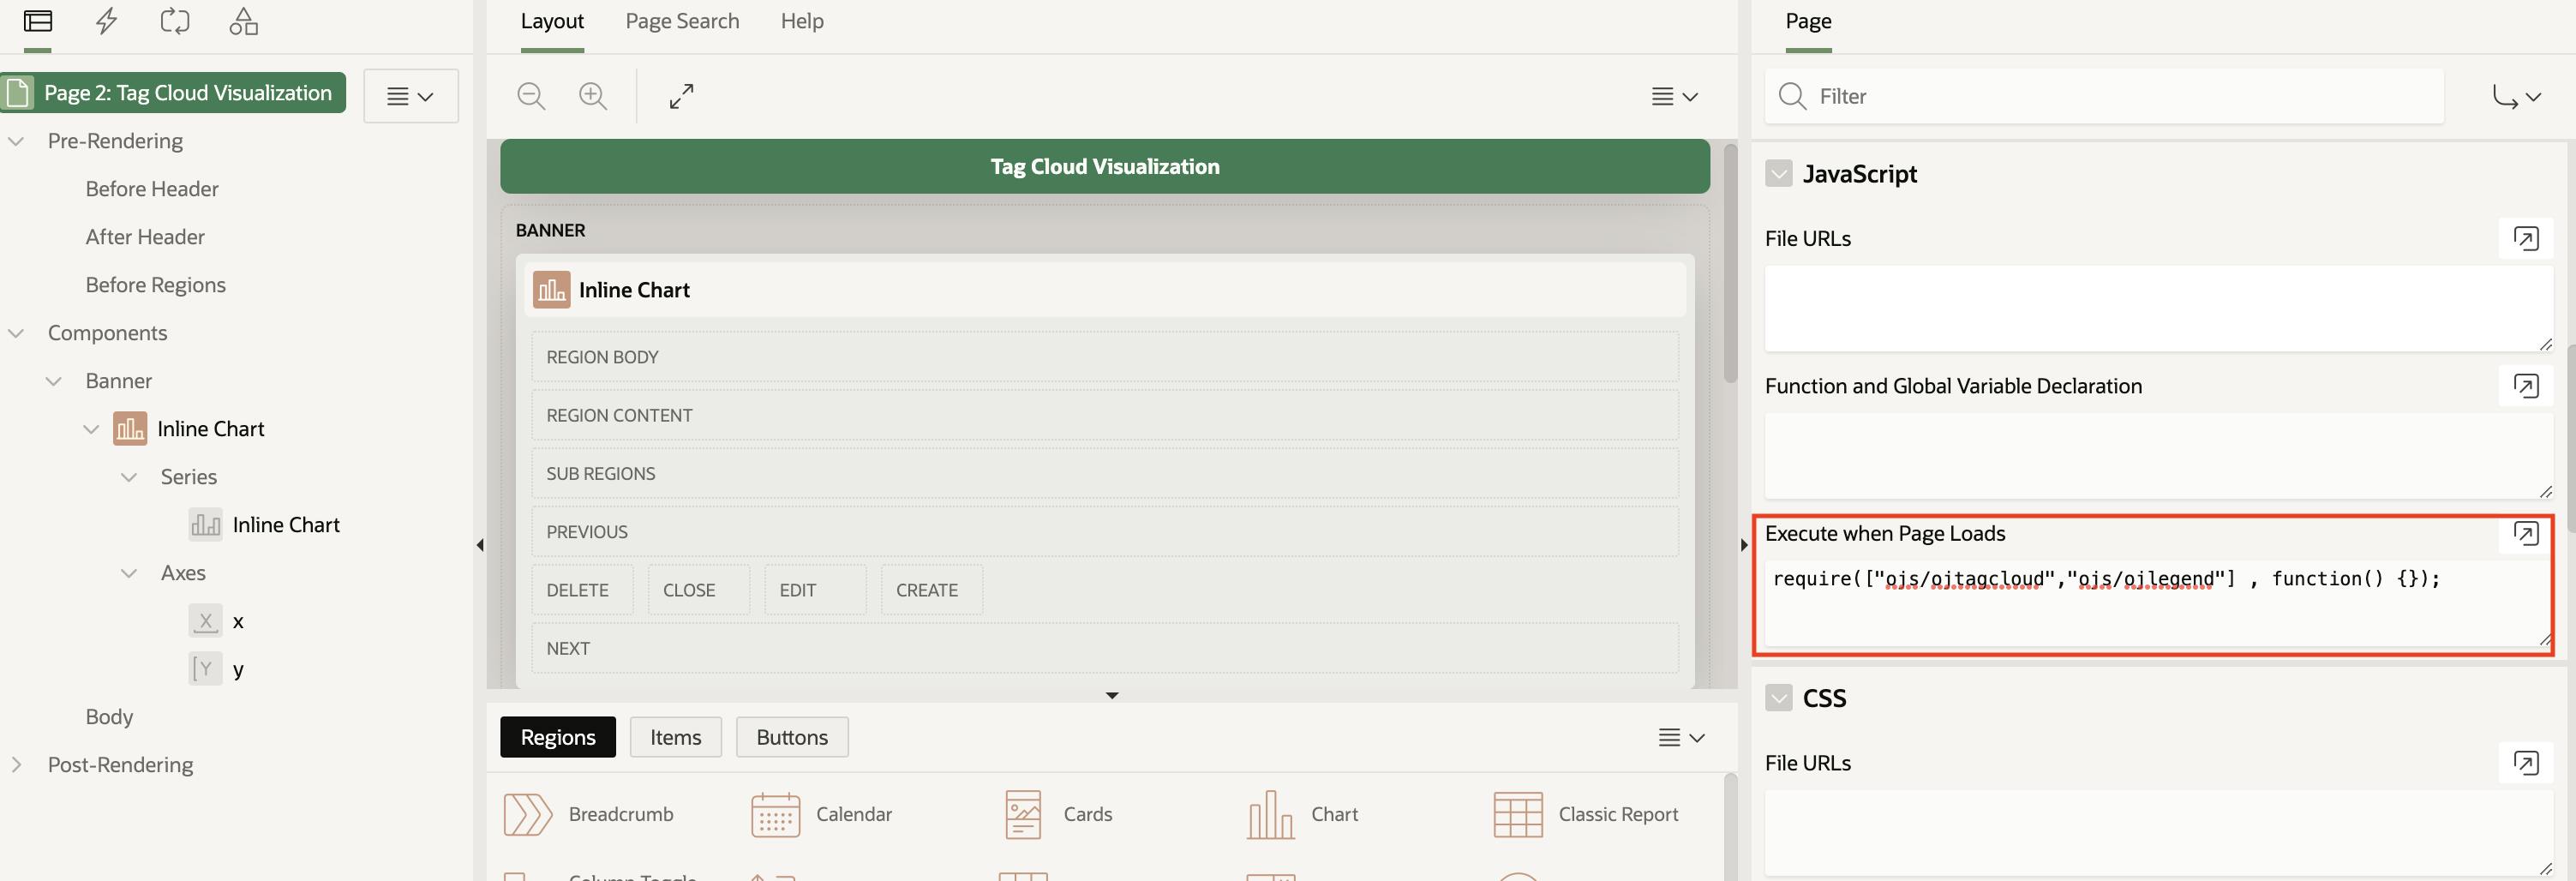
Here, you can easily observe that we do not have to include anything in the JavaScript File URLs and CSS File URLs. In the case of the explicit method, you will require to mention the respective library.
Note: This technique is described to explain concepts only. This may not be the best practice to follow. It is always recommended to put frequently used JS libraries or functions in a common file and should be referenced at the application level.
Add Dynamic Content Region to generate a visualization
In this step, you need to place dynamic content region and write PL/SQL code based on the data to be displayed. Here, I have used EMP/DEPT sample dataset which you can install from the following path:
SQL Workshop -> Utilities -> Sample Datasets
Below is the screenshot of Placing the Dynamic Content Region in the Body section.

Use below PL/SQL code to generate Tag Cloud Visualization along with legends. This code will help you understand the underlying JSON structure to be used for presenting data. You may fine-tune the below code to implement in real-world applications using large datasets.
Declare

lv_cloud_tag_items clob;
lv_legend_items clob;
lv_chart_output clob;
lv_salary_band clob;


Begin

-- Prepare JSON for Tag Cloud Items

select JSON_ARRAYAGG(
                      JSON_OBJECT(
KEY 'id' VALUE TO_CHAR(EMPNO),
KEY 'label' VALUE ENAME,
KEY 'value' VALUE SAL,
KEY 'categories' VALUE
case when SAL between 0 and 1000 then JSON_ARRAY('0-1000')                                             when SAL between 1001 and 2000 then JSON_ARRAY('1001-2000')
when SAL between 2001 and 3000 then JSON_ARRAY('2001-3000')             when SAL > 3000 then JSON_ARRAY('Above 3000')   end,
                                        KEY 'color' VALUE
case when SAL between 0 and 1000 then '#2E86C1'
when SAL between 1001 and 2000 then '#7D3C98'
when SAL between 2001 and 3000 then '#F39C12'
when SAL > 3000 then '#E74C3C'  end ,
KEY 'shortDesc' VALUE 'JOB - ' || JOB || ': SALARY - ' || SAL
                    )
                        FORMAT JSON ORDER BY ENAME RETURNING CLOB
                    ) into lv_cloud_tag_items
from EMP_DEPT_V where JOB in (select COLUMN_VALUE from apex_string.split(NVL(:P2_JOB_LIST,JOB),':'));

/*--Create Unique List for Legend Items. I have assumed that your database version is 19c & Above. You may use your own method to find uqniue list for Legend Items.--*/

select  LISTAGG( distinct
case when SAL between 0 and 1000 then '0-1000'
when SAL between 1001 and 2000 then '1001-2000'
when SAL between 2001 and 3000 then '2001-3000'
when SAL > 3000 then 'Above 3000'  end,',' ) SALARY_BAND
into lv_salary_band
from EMP_DEPT_V where JOB in (select COLUMN_VALUE from apex_string.split(NVL(:P2_JOB_LIST,JOB),':'));

-- Prepare JSON for Legend Items based on Unique List

select JSON_ARRAYAGG(
                        JSON_OBJECT ( KEY 'items' VALUE (JSON_ARRAY (JSON_OBJECT(
KEY 'text' VALUE COLUMN_VALUE,
KEY 'color' VALUE
case when COLUMN_VALUE = '0-1000' then '#2E86C1'
when COLUMN_VALUE = '1001-2000' then '#7D3C98'
when COLUMN_VALUE = '2001-3000'  then '#F39C12'
when COLUMN_VALUE = 'Above 3000' then '#E74C3C' end
                                    ))))
                    ) into lv_legend_items
from apex_string.split(lv_salary_band,',');

-- Generate Chart for Tag Cloud and Pass the JSON

lv_chart_output := '<oj-tag-cloud
            id = "TAG_CLOUD1"
            layout ="cloud"
            selection-mode = "single"
            animation-on-display="auto"
            animation-on-data-change="auto"
            items="' || apex_escape.html(lv_cloud_tag_items) || '">
            </oj-tag-cloud>';

-- Generate Legend and Pass the JSON

lv_chart_output := lv_chart_output ||  '<oj-legend
            id = "LEGEND1"
            text-style = {"fontSize":"15px","fontWeight":700}
            symbol-height = 10
            class = "legend-size"
            hide-and-show-behavior="on" halign="center"
            orientation="horizontal"
            sections="'||apex_escape.html(lv_legend_items) || '">
            </oj-legend>';

-- Return Final HTML Output

return lv_chart_output;

End;
In the above code, page item "P2_JOB_LIST" is Popup LOV and is used to filter data. You will see the usage of this item in the next part of the blog post. So, you may keep it as it is for now.
Here, you also need to add inline CSS as mentioned below in the page level attribute to align the legend component:
.legend-size {
   height: 40px;
   width: auto;
}
After performing all the above steps, you should be able to see the following result without any interactive functionality.
Summary
In this first part of the series, I have only covered visualization of data with Tag Cloud and Legend components. I hope that it has given you more insight into how to use the new dynamic content region. In the next parts, you will learn to include filtering data, interacting with legend items and providing drill-down functionality.
I hope to come up with interesting use cases and content in the coming days. So, please stay tuned and do provide your feedback.